Introduction
In the analytics and visualization you use your collected, processed, and transformed data to create actionable insights. We need to understand which analysis and visualization methods and tools to use based on your audience’s expectations for access and the insight they expect to gain from your visualizations.
Table of Contents
This Page is divided into following parts:
- Operational characteristics of an analysis and visualization solution
- Select the appropriate data analysis solution for a given scenario
- Select the appropriate data visualization solution for a given scenario
1. Operational Characteristics Of An Analysis And Visualization Solution
Here we will understand the analysis and visualization components of a data analyitcs solution and which AWS servies implement these concepts
Purpose Built Analytics Services
Choose the correct approach and tool for your analytics problem. Know the AWS purpose bilt analytics services:
- Athena
- Elasticsearch
- EMR
- DynamoDB
- Kinesis Family (Data Streams, Firehose, Analytics, Video Streams)
- Redshift (Spectrum)
- MSK (Managed Streaming for Apache Kafka)
- QuickSight
- Also know where to use
- S3
- EC2
- Glue
- Lambda
Visualization Methods
Understand refresh schedule, delivery method, and access method based on a scenario. We use data from heterogeneous data sources in visualization solution.
Refresh Schedule - Real-time Scenarios
Scenarios that question the appropriate refresh schedule based on data freshness requirement Real-time scenarios, typically using Elasticsearch and Kibana
- Refresh_Interval in Elasticsearch domain updates the domain indices; determines query freshness
- Default is every second - expensive, make sure the shards are evenly distributed.
- Formula: Number of shards for index = number of shards per node * number of data nodes
- Balance refresh rate cost with decision making needs
Refresh Schedule - Interactive Scenarios
Real-time scenarios, typically ad-hoc exploration using QuickSight Refresh SPICE data
- Refresh a data set on a schedule, or you can refresh your data by refreshing the page in an analysis or dashboard
- Use the CreateIngestion API operation to refresh data
Data set based on a direct query and not stored in SPICE, refresh data by opening the data set
Refresh Schedule - EMR Notebooks
Using EMR Notebooks to query and visualize data. Data refreshed every time the notebook is run
- Expensive proces, balance refresh rate cost with decision making needs
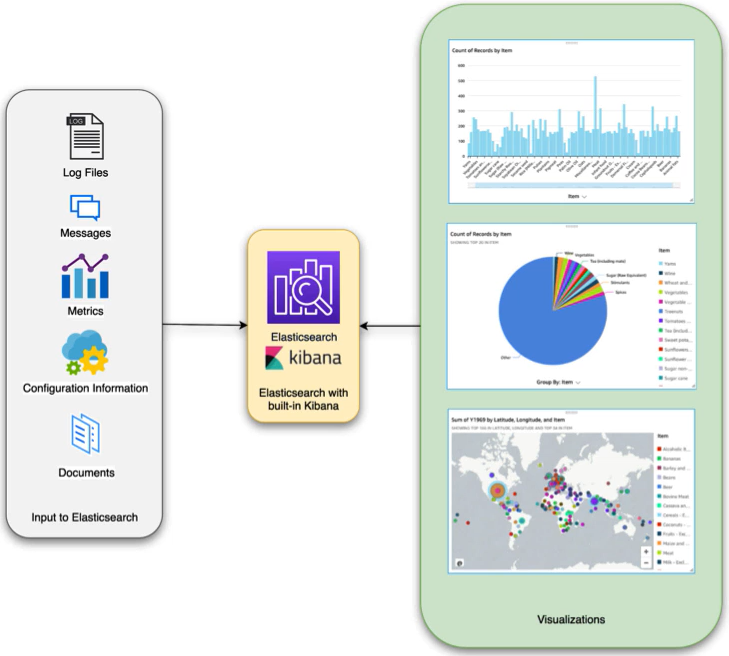
Kibana Visualizations
Visualization Tool
- Open-source data visualization and exploration tool used for log and time-series analytics, application monitoring, and operational intelligence use cases. Especially where searching is the main need.
- Tight integration with Elasticsearch
- Charts and reports to interactively navigate through large amounts of log data
- Pre-built aggregations and filters
- Dashboards and reports to share
Kibana Configuration
- To visualize and explore data in Kibana, you must first create index patterns
- Index patterns point Kibana to the Elasticsearch indexes containing the data to explore
- Explore data with Kibana’s data discovery functions
- Kibana visualizations are based on Amazon Elasticsearch queries
Appropriate Analytics Service
Analytics
- Interactive analytics
- Service: Athena
- Big data processing
- Service: EMR
- Data warehousing
- Service: Redshift
- Real-time analytics
- Service: Kinesis
- Operational analyitcs
- Service: Elasticsearch
- Dashboards and visualizations
- Service: QuickSight
Data movement
- Real-time data movement
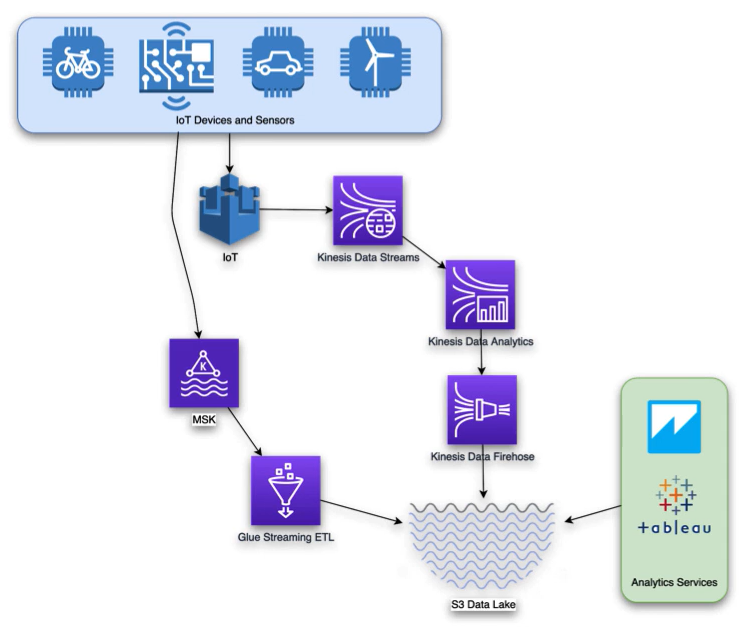
- Service: MSK, Kinesis Family, Glue
Data Lake
- Object Storage
- Service: S3, Lake Formation
- Backup and archive
- Service: S3 Glacier, AWS Backup
- Data catalog
- Service: Glue, Lake Formation
- Third-part data
- Service: AWS Data Exchange
Predictive analytics and machine learning
- Frameworks and interfaces
- Service: AWS Deep Learning AMIs
- Platform services
- SageMaker
Use Case - Data Warehousing

Use Case - Big Data Processing

Use Case - Real Time Analytics with MSK and Kinesis

Use Case - Operational Analytics

2. Select The Appropriate Data Analysis Solution For A Given Scenario
Here we will understand which analysis solution for given scenario is the best.
- We select the appropriate type of analyis
- We select best solution for a scenario
- Analysis method
- Analysis tools
- Analysis technology
3. Select The Appropriate Data Visualization Solution For A Given Scenario
Here we will understand visualization solution characteristcs and AWS services and options for visualization.
- Presentation type
- Refresh schedule
- Delivery method
- Access method
Moreover we will understand aggregating data from different types of data sources into your visualization solution.